Local citizens and scientists are looking for Columbia’s hottest neighborhoods.
No, they’re not studying where the real estate market is up. Instead, they’re looking for places where temperatures spike 10 to 20 degrees higher than their surrounding areas because of geographic features like concrete, buildings, and lack of trees. On summer’s hot days, people who live in these “urban heat islands” can face a higher risk of heat-related health problems.
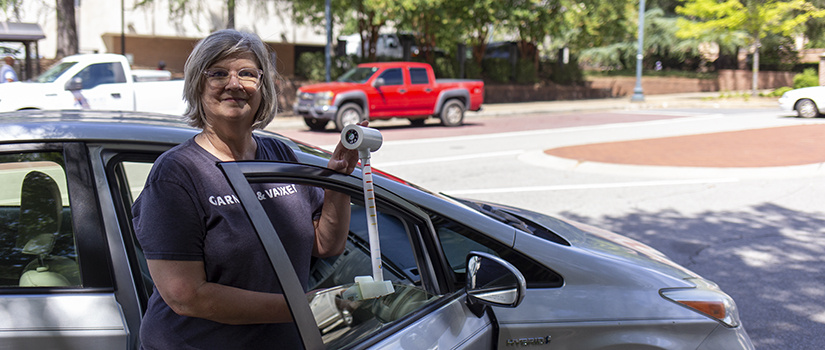
To find these hot zones, geography professor Kirstin Dow organized a heat mapping project with the City of Columbia Tree and Appearance Commission. On Saturday, August 6, volunteers hit the streets with sensors on their vehicles to measure temperatures as they drove routes throughout the city.
The location and temperature data collected by those sensors will allow Dow and other researchers to create a heat map. Then, city planners can use that map to address neighborhood-specific heat problems through tree planting and other projects.
Making the map
- The National Oceanic and Atmospheric Administration provided equipment for the project as part of its annual community heat map program.
- The sensor fits over a passenger-side window, which is then rolled up to hold the sensor out of the vehicle.
- 32 volunteers traveled 16 routes spanning 190 square miles in the Columbia area three times on August 6.
- Using geographic information system technology, a map will be created to show Columbia’s hot spots.
Why it matters
- Extreme heat is the deadliest weather event, according to NOAA.
- Understanding which neighborhoods face the greatest heat risks will help planners in Columbia and Richland County abate heat problems.
- The Biden administration recently announced $2.3 billion in funding to help communities prepare for heat-related emergencies, as well as $385 million to help households with energy costs, such as summer cooling. Data from the heat map survey could identify areas where such assistance could be targeted.
Other partners
The application for the NOAA heat mapping program was submitted by the City of Columbia Tree and Appearance Commission and the with the financial and in-kind support of University of South Carolina Department of Geography, Benedict College Department of Biology, Chemistry, and Environmental Health; Columbia Green; the City of Columbia Planning and Development Services Department and the Public Works Department; the Richland County Conservation Commission, and the Richland County Department of Community Planning and Development. In addition, the Charleston Resilience Network, Columbia Garden Club, Gills Creek Watershed Association, Medical University of South Carolina, Richland County Bar Association, SC Energy Office, SC Health Professionals for Climate Action, SC Wildlife Federation, SC Office of Resilience, and Sustain SC all provided letters of support and expressed interest in using the results to inform their work in the future.
Read more details on the City of Columbia website for the project.