Precision Baseball
Moore School professors bring Gamecock baseball stats to life
Posted on: February 26, 2019; Updated on: February 26, 2019
By Madeleine Vath, Madeleine.Vath@moore.sc.edu, 803-777-4544
Pitching a baseball seems like a simple motion to the average fan, but there is a science behind it that the casual observer is likely unaware of. The windup, the stretch, the release. The pitching motion consists of a sequence of body movements that start when the pitcher lifts his lead foot and culminates when the ball leaves his hand, headed for home plate. The batter might say the ball hops, drops, curves or breaks as it heads toward him. The pitcher says he threw a fastball, curve ball, slider or sinker. No matter how the ball is pitched or hit, the motion occurs at a rapid pace, making real-time analysis with the naked eye quite difficult.
Having real performance data for each player changes the conversation — but you have to be able to turn data into insights to make an effective change in strategy. Enter Moore School management science professors Stacey Mumbower, Joel Wooten and Michael Galbreth. In February of 2018, Gamecock baseball reached out to the three with a problem: The coaches had lots of raw data from TrackMan, their new data collection system for capturing pitching and hitting statistics, but they needed help making sense of it.
“We felt like we were trying to drink water out of a fire hose,” says Trip Couch, Gamecock baseball’s director of player development, of when they were first looking at the raw data reports.
TrackMan records everything related to the physical ball and anything it does. Velocity, spin rate and pitch break are all tracked, but so are measurements about the exit speed off the bat, launch angle, hang time and a dozen other variables. While the raw data in TrackMan is copious, the reports it produces are limited.
“The system generates static reports in a particular format, but there are only so many questions you can answer with one document,” says Galbreth, academic director of the Center for Applied Business Analytics.
The first priority for the three professors was figuring out how to wrangle all the raw data into a more useful format.
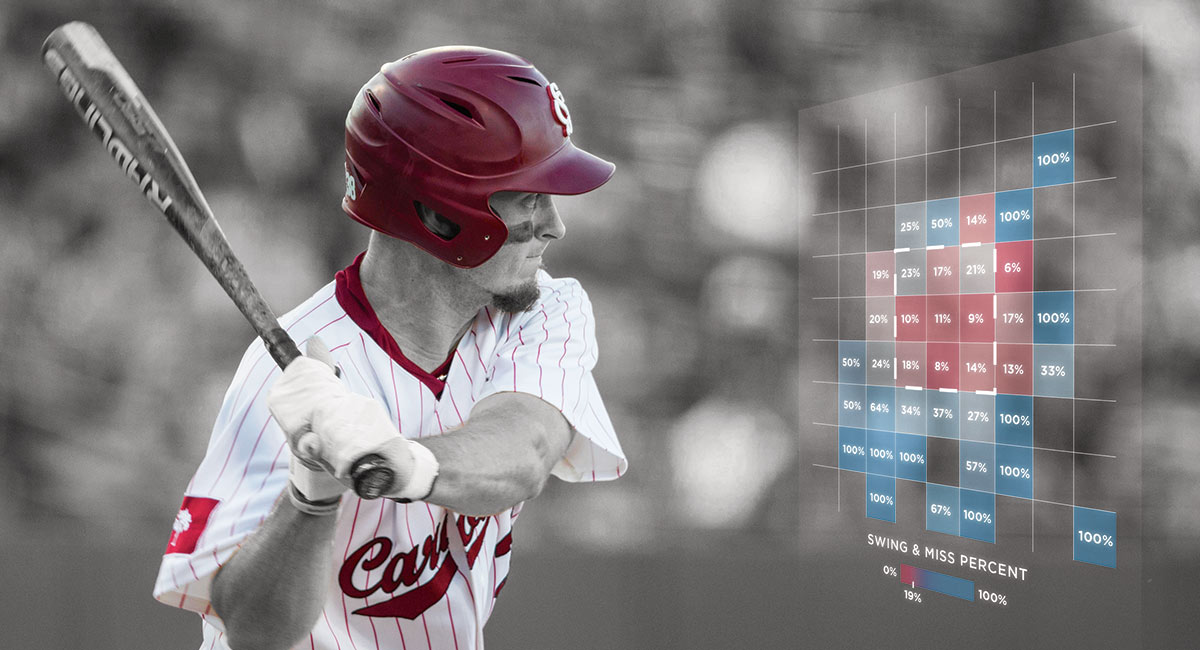
“Stacey took the lead and developed a series of dashboards that lets the coaches interact with the data, instead of just looking at it — pitch location and pitcher release point visuals were two of the first,” Galbreth says.
Using Tableau, a cutting-edge data visualization software taught in the Moore School at the undergraduate and MBA levels, the group mapped the variables — such as the coordinates of the pitcher’s hand when the ball is released and the type of pitch thrown — onto a series of colorful plots. Instead of hundreds of numbers on a report resembling a tax table, it’s formatted more like a visual search on Kayak, with sliders and images overlaid on a map.
After each home game, the new data sets from TrackMan are imported into the dashboards to help the coaches strategize for upcoming games. Coaches can view changes over time for the team as a whole and for individual players in the “pitcher vs. hitter battle,” as Couch puts it.
Mumbower says all the players look very different in the data, and that those differences translate very clearly on the field. “What we put together is helping the coaches ‘see’ what they thought they already knew. For example, they might have a theory about a certain batter’s tendencies, and looking at a dashboard helps them see whether it’s true,” says Mumbower, director of the Center for Applied Business Analytics.
“It’s amazing how visible and immediately obvious things such as pitcher release point and disguising a changeup are in the data,” she says.
Couch agrees and says, up to this point, all that their coaching has really been based on is educated guesses.
“These dashboards allow us to show the players graphically what their strengths and weaknesses are,” he says. “For so long, a lot of our coaching has been opinion, but now we can show them the hard data.”
In the process of making the data more useful for coaches, the team of professors discovered as soon as the data was presented visually, it became useful for the players, too.
“This generation is very visual-oriented, so this makes it easier for them,” Couch says.
Now a coach can pull up all of a player’s pitches from the season to highlight whether adjustments from practice are taking hold. Or a snapshot of last night’s game can reinforce lessons — especially since human perception is imperfect (that low-and-outside strike that was complained about was actually right down the middle). Once the players are given these new areas to tweak and improve, they can work to create “new muscle memory” based on the analytics, Couch says.
“Moving forward, once we have these baseline things in place, then we’d like to see some predictive modeling,” Couch says. “As this develops, it would be neat to see students get involved or potentially classes be built around this type of work.”
The collaboration between Gamecock baseball and the management science faculty has been a success. The goal after collecting any set of data for an organization is to make it useful, and the group has turned the original raw numbers into a set of visual dashboards, which has sparked a whole new way of looking at the game.
“We probably haven’t even scratched the surface of what they can do,” Couch says of the Moore School analytics team. “A lot of the stuff they’ve done is probably elementary for people at their level, but for us, it was like moving mountains.”
This team of researchers hopes to continue working with the Gamecock baseball team to tweak the dashboards and advance how the team prepares.
“At some point, I think we’ll move away from simply visualizing data and try to do more predictive analysis,” Mumbower says.
Then, the team will be in the big leagues, with sophisticated data analysis rivaling some of the most advanced teams in the majors.