How to Add Images in Excel
The way that you add alt text to basic images in Excel is similar to how you would add alt text in Word, but the way that you add images has a notable difference: You can either place images in cell or over cell. It's generally best to use "place in cell" so that screen reader users can navigate to the image containing alt text as they would navigate to any data cells, whereas "place over cell" creates floating images that maintain a separate focus order.
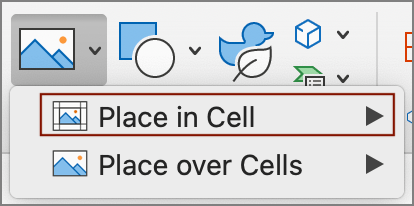
To place an image inside a cell:
- Navigate to the Insert tab in the ribbon.
- Select the Pictures dropdown.
- Select Place in cell, then choose your image.
Either way you choose to add an image to your sheet, you can still select View Alt Text... from the image's context menu to write your alt text. You can also switch an image from "Place in cell" to "Place over cell" within the context menu.
Charts and Alt Text
Charts can be a useful way to visualize your data and analyze trends. For a chart to be accessible, it needs to have meaningful alt text (as well as accessible color usage and proper labels).
Unlike standard pictures, you can't place a chart inside a cell. By default, when you create a chart, it is placed over the cells of your sheet. Within the context menu of the chart, you can select Move Chart... to move your chart to its own sheet.
Whether your Excel chart is placed over cells on the same sheet as its corresponding data table or within its own sheet, your chart should have a short description within its alt text field.
Include in the alt text field:
- The title of your chart.
- The type of chart (e.g., bar chart).
- Where to find the data table.
Example Chart:
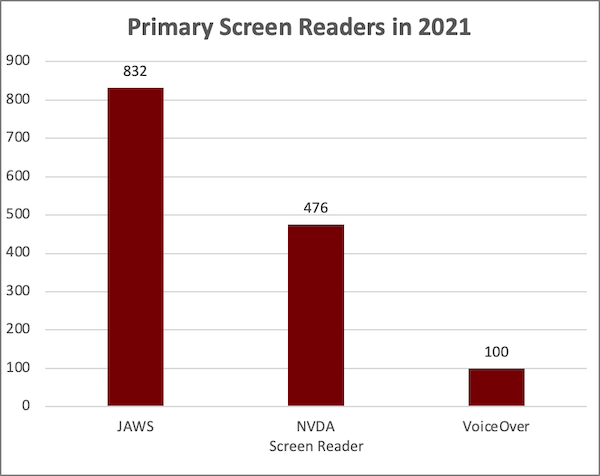
Example Alt Text: Primary Screen Readers in 2021 bar chart. The data table is located in the Primary Screen Readers sheet, starting at cell A2.
Example Data Table:
| JAWS | NVDA | VoiceOver |
|---|---|---|
| 832 | 476 | 100 |